
Trump’s most-favored-nation (MFN) drug agenda was pitched as consumer relief at home. However, its deeper ambition was to push wealthy foreign markets to pay more and to rebalance who finances pharmaceutical innovation.
Over the past year, Donald Trump has turned “most-favored-nation” pricing into one of the signature ideas of his healthcare agenda. The public case for MFN has been straightforward enough: Americans should not pay more than citizens of other wealthy countries for the same medicines. But the administration’s own language reveals a more ambitious goal. MFN was never framed only as a domestic price-cutting policy. It was framed as an effort to rebalance the cost of pharmaceutical innovation.
Trump has said that “the United States will no longer subsidize the healthcare of foreign countries” and that “other countries should pay research and development, too.” Chris Klomp, Chief Counselor of the United States Department of Health and Human Services and one of the administration’s most forceful policy messengers, has been even more forthright. In public interviews and event remarks, he has called the status quo “foreign free riding,” argued that the goal is to “have everybody pay a little more, have us pay a little bit less,” and explained the administration’s ask to manufacturers this way: “The only ask is don’t undercut us somewhere else.”
That is the core of the MFN thesis. Reduce public spending where possible. Lower some US out-of-pocket costs by bypassing parts of the traditional reimbursement chain. Support domestic manufacturing. But above all, shift more of the burden of pharmaceutical innovation away from the United States and onto other wealthy markets. The question is whether the economics of that rebalancing actually work.
For many large pharmaceutical companies, the playbook remains unchanged: a structured yet rigid process built for a more predictable world. But the cracks are starting to show.
We told the manufacturers, price where you want. That's fine, just don't undercut us in another wealthy country.
- Chris Klomp, Chief Counselor of the United States Department of Health and Human Services, for Stat
Four priorities, one underlying initiative
In broad terms, the administration’s MFN priorities appear to be fourfold. First, reduce government spending, especially in the Medicaid program. Second, use whatever levers it has at its disposal to encourage more US-based pharmaceutical manufacturing and supply resilience. Third, lower cash-pay prices for at least some patients by routing them around the ‘middlemen’ in the system. And fourth, rebalance the global financing of drug development so that ex-US markets pay more and the United States pays less.
The first three priorities are visible enough. However, the fourth could be the most consequential from a long-term perspective. It is also the most difficult. The administration’s theory is not that the industry must simply accept a smaller pie of total revenue. The theory is that foreign markets can be pushed to shoulder more of the revenue burden, allowing US prices to fall without collapsing the economics of innovation.
Table 1. Population of the United States and the “GENEROUS 8” comparator markets. Population figures in millions, based on World Bank data.
| Market | Population (2024, mm) |
| United States | 340.0 |
| Japan | 124.0 |
| Germany | 83.5 |
| United Kingdom | 69.2 |
| France | 68.6 |
| Italy | 59.0 |
| Canada | 41.3 |
| Switzerland | 9.0 |
| Denmark | 6.0 |
| Total | 800.6 |
Table 1 shows the scale of the problem immediately. Even before any pricing assumptions are introduced, the United States is carrying an outsized share of the commercial opportunity (42% of the market basket population). That matters because the administration’s burden-sharing argument depends on whether the ex-US markets are large enough - and willing enough - to absorb materially higher net prices without breaking the launch logic for new medicines.
What the baseline economics look like
As a thought exercise, we developed a very simple model to investigate this question. For the purposes of this analysis, we assume a hypothetical product with a net price of 100 in the United States and a uniform net price across all GENEROUS 8 markets as a proportion of that net price, i.e. 20% to 60% of the US net price. That means that at the low end, the US price is five times that of the absolute prices in the GENEROUS 8 markets. That is a useful range because, in practice, many launches outside the US do cluster around that price band. To keep things simple, we assumed that the net willingness to pay on an absolute basis was the same across all GENEROUS 8 markets even though in reality net prices across these markets can vary substantially.
Table 2 presents the non-MFN baseline: a world in which the United States keeps its historically high prices and the comparator markets continue paying materially less.
| Market | @20% | @30% | @40% | @50% | @60% |
| United States (priced at 100) | 340.1 | 340.1 | 340.1 | 340.1 | 340.1 |
| Japan | 24.8 | 37.2 | 49.6 | 62.0 | 74.4 |
| Germany | 16.7 | 25.1 | 33.4 | 41.8 | 50.1 |
| United Kingdom | 13.8 | 20.8 | 27.7 | 34.6 | 41.5 |
| France | 13.7 | 20.6 | 27.4 | 34.3 | 41.2 |
| Italy | 11.8 | 17.7 | 23.6 | 29.5 | 35.4 |
| Canada | 8.3 | 12.4 | 16.5 | 20.7 | 24.8 |
| Switzerland | 1.8 | 2.7 | 3.6 | 4.5 | 5.4 |
| Denmark | 1.2 | 1.8 | 2.4 | 3.0 | 3.6 |
| Total 9 markets (US + GENEROUS8) | 432.2 | 478.3 | 524.3 | 570.4 | 616.5 |
The totals underscore why the United States remains the anchor market. In the baseline case, the 9-market revenue pool ranges from roughly 432 to 616 across the pricing scenarios with the US contributing from 78% to 55% of sales. Even in the higher ex-US scenarios, the United States remains the single dominant contributor. This is precisely what the administration wants to change.
What happens when MFN referencing comes into play?
Table 3 then applies the impact of MFN price referencing. In this situation, the US price falls to the second lowest, GDP-PPP adjusted net price amongst these 8 markets. For this baseline, the ex-US markets do not yet move up; only the US price comes down. That creates the central stress test for the administration’s thesis: how large is the potential revenue hole if foreign markets do not start paying more?
Table 3. Price and revenue by market after MFN referencing. US absolute price based on 2nd lowest GDP-PPP adjusted price (Denmark).
| Market | @20% | @30% | @40% | @50% | @60% | |||||
| Price | Revenue | Price | Revenue | Price | Revenue | Price | Revenue | Price | Revenue | |
| United States | 20.5% | 69.7 | 30.7% | 104.5 | 41.0% | 139.3 | 51.2% | 174.1 | 61.4% | 209.0 |
| Japan | 20.0% | 24.8 | 30.0% | 37.2 | 40.0% | 49.6 | 50.0% | 62.0 | 60.0% | 74.4 |
| Germany | 20.0% | 16.7 | 30.0% | 25.1 | 40.0% | 33.4 | 50.0% | 41.8 | 60.0% | 50.1 |
| United Kingdom | 20.0% | 13.8 | 30.0% | 20.8 | 40.0% | 27.7 | 50.0% | 34.6 | 60.0% | 41.5 |
| France | 20.0% | 13.7 | 30.0% | 20.6 | 40.0% | 27.4 | 50.0% | 34.3 | 60.0% | 41.2 |
| Italy | 20.0% | 11.8 | 30.0% | 17.7 | 40.0% | 23.6 | 50.0% | 29.5 | 60.0% | 35.4 |
| Canada | 20.0% | 8.3 | 30.0% | 12.4 | 40.0% | 16.5 | 50.0% | 20.7 | 60.0% | 24.8 |
| Switzerland | 20.0% | 1.8 | 30.0% | 2.7 | 40.0% | 3.6 | 50.0% | 4.5 | 60.0% | 5.4 |
| Denmark | 20.0% | 1.2 | 30.0% | 1.8 | 40.0% | 2.4 | 50.0% | 4,0 | 60.0% | 3.6 |
| Total 9 markets | 161.8 (-63%) | 242.7 (-49%) | 323.5 (-38%) | 404.4 (-29%) | 485.3 (-21%) | |||||
This is where the results become hard to ignore. In this example, the US net price becomes equal to the GDP-PPP adjusted price of Denmark as the second lowest benchmark with Switzerland being the lowest. In reality, manufacturers would be unlikely to allow Denmark to be the price reference and to impact US revenue so substantially, but we have ignored opportunities to individually adjust price targets across the different markets.
Due to this US net price adjustment, the total 9-market revenue falls by 63% when the ex-US willingness to pay is only 20% of the US price. Even at 40%, the loss is still 38%. Only when the ex-US starting point reaches 60% does the decline narrow to about 21%.
Of course, the objective of MFN is not simply that US prices go down. The only way to preserve the revenue pool is if foreign markets pay more, compared to what they have historically been paying. The real question is how much more, and is it realistic for these markets to move that far?
How much would foreign markets have to move?
Table 4 addresses the question directly. It asks what the absolute ex-US prices would need to be, considering the net price decrease in the US because of MFN, in order to preserve current 9-market revenue.
Table 4. Required absolute ex-US prices under MFN to maintain revenue pool relative to the baseline, innate willingness to pay in current valuation frameworks.
| Market | @20% | @30% | @40% | @50% | @60% | |||||
| Price | Revenue | Price | Revenue | Price | Revenue | Price | Revenue | Price | Revenue | |
| United States | 54.7% | 186.1 | 60.5% | 205.9 | 66.4% | 225.8 | 72.2% | 245.6 | 78.0% | 265.4 |
| Japan | 53.4% | 66.3 | 59.1% | 73.3 | 64.8% | 80.4 | 70.5% | 87.4 | 76.2% | 94.5 |
| Germany | 53.4% | 44.6 | 59.1% | 49.4 | 64.8% | 54.1 | 70.5% | 58.9 | 76.2% | 63.6 |
| United Kingdom | 53.4% | 37.0 | 59.1% | 40.9 | 64.8% | 44.9 | 70.5% | 48.8 | 76.2% | 52.7 |
| France | 53.4% | 36.7 | 59.1% | 40.6 | 64.8% | 44.5 | 70.5% | 48.4 | 76.2% | 52.3 |
| Italy | 53.4% | 31.5 | 59.1% | 34.9 | 64.8% | 38.2 | 70.5% | 41.6 | 76.2% | 45.0 |
| Canada | 53.4% | 22.1 | 59.1% | 24.4 | 64.8% | 26.8 | 70.5% | 29.1 | 76.2% | 31.5 |
| Switzerland | 53.4% | 4.8 | 59.1% | 5.3 | 64.8% | 5.8 | 70.5% | 6.3 | 76.2% | 6.9 |
| Denmark | 53.4% | 3.2 | 59.1% | 3.5 | 64.8% | 3.9 | 70.5% | 4.2 | 76.2% | 4.6 |
| Total 9 markets | 432.2 | 478.3 | 524.3 | 570.4 | 616.5 | |||||
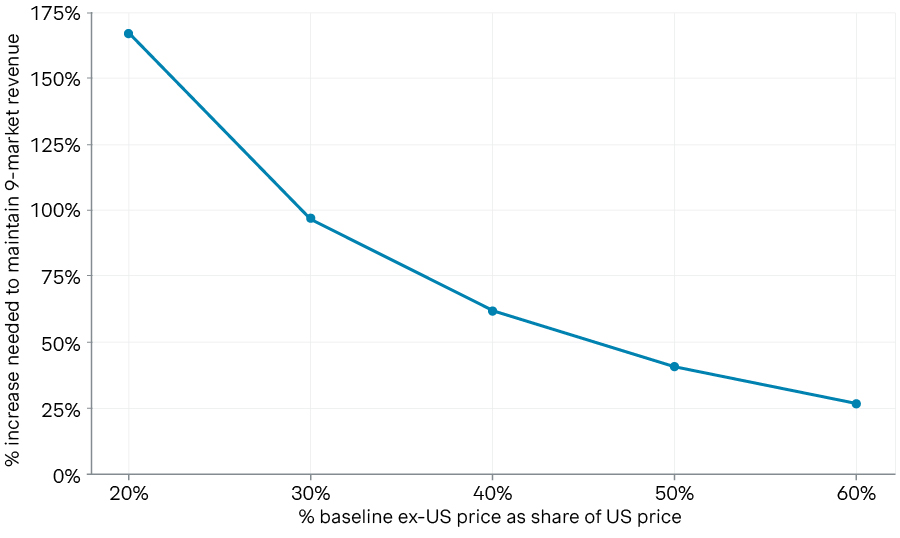
The line graph in illustration 5 shows the significance of the price increases necessary to maintain the same revenue. If the ex-US markets would have valued a pharmaceutical innovation at only 20% to 30% of the US net price, the price increases required to preserve the overall revenue pool are extraordinary: roughly 167% and 97%, respectively. This is the range we often see today for fairly high value therapeutics, such as targeted oncology therapies. In order for pharmaceutical companies to achieve the same revenues, ex-US markets would need to double what they are currently spending on these types of innovations. Only when the ex-US willingness to pay is already relatively high does the math begin to look achievable. Considering a baseline willingness to pay of 60% of the US price, a price increase of roughly 27% preserves the revenue across the 9 markets. In other words, the administration’s theory becomes plausible only when the pre-existing gap is already narrow.
Illustration 5. The rebalancing curve: The line graph visualizes how significantly ex-US prices must increase over baseline in order to maintain the same 9-market revenue pool as a function of their innate willingness to pay based on current valuation frameworks.
Ex-US Price Increase Needed to Maintain 9-Market Revenue
Source: Simon-Kucher insights
The real bet
This is what makes MFN such an existential moment for the pharmaceutical industry. It is not merely an anti-middleman idea, though it borrows some of that language. It is not merely a Medicaid savings tool, though it certainly aims at that. It is not merely a direct-to-consumer affordability play, though TrumpRx gives it a retail face.
At its core, MFN is a bet that the geographic foundation of pharmaceutical value recognition can be redistributed: that the American share can come down, the foreign share can go up, and the industry can still earn enough to keep developing new innovations.
That bet may work for some products, for example, high-value therapies where the international willingness to pay is already closer to US levels. But for medicines facing very wide gaps between US and ex-US net pricing, the path is much steeper. The math suggests that in those cases, preserving current revenue would require foreign markets to absorb price increases that are not just politically difficult, but structurally hard to imagine.
That leaves pharmaceutical companies in an awkward position. They still have fiduciary obligations to maximize returns for their shareholders. Pharmaceutical manufacturers also make increasingly prominent ethical commitments to bring innovation to patients across all markets. In a true MFN landscape, those commitments may be in direct opposition. Some companies may conclude that broad launches remain worthwhile. Others may narrow their footprints, delay launches, or rethink the economics of development altogether.
So the real legacy question for Trump’s MFN agenda is not whether it changed the conversation. It clearly has. The real question is whether wealthy foreign markets will actually move enough to make the arithmetic work. If they do, MFN could become the beginning of a new burden-sharing model for global biopharma. If they do not, MFN may still reduce some US prices, but at the cost of a smaller global revenue pool, tougher launch decisions, and a more fragmented market for innovation.
Either way, one thing is already clear: MFN was never just about lowering drug prices in America. It was always about deciding who should pay for the next generation of medicines.