
We discuss how most-favored-nation (MFN) pricing could reshape global launch sequencing, market access, and the economics of pharmaceutical innovation.
For all the noise around pharmaceutical policy in Washington, very little truly changes the structure of the global market. President Trump’s most-favored-nation pricing agenda may be the exception.
In less than a year, MFN has moved from campaign-style rhetoric to a real organizing principle of US drug policy. The administration has paired pressure from threatened tariffs with pressure from the proposed GLOBE and GUARD models, and it has already brought 17 major manufacturers into “voluntary” agreements that, in substance, begin importing international price controls into the United States.
That combination of carrot and stick is most powerful against companies with large, mature portfolios already exposed to Medicaid, Medicare, and the prospect of tariffs. But for the manufacturers whose valuation is weighted more heavily toward pipeline assets or early-life-cycle products, the calculation looks very different. Applying MFN concepts to Medicaid or a limited out-of-pocket channel is one thing; applying MFN logic to newly launched products across the whole US market is something else entirely.
When pricing policy starts to reshape launch strategy
That is where the real economic shock sits. The administration’s theory is straightforward: lower US prices but preserve industry economics by forcing wealthy ex-US markets to pay more. Chris Klomp has said the goal is to “have everybody pay a little more, have us pay a little bit less.” In other words, this is not simply a price-control project. It is an attempt to redistribute the global revenue burden for pharma innovation.
But ambitious policy logic and commercial reality are not the same thing. The financial impact of MFN on newly launched products is potentially enormous because the difference in willingness to pay between the United States and most ex-US markets is still vast. Once US prices are linked to foreign net prices, launch strategy itself becomes part of pricing strategy.
Pharma CEOs have started saying the quiet part out loud. Pfizer’s CEO Albert Bourla framed the dilemma bluntly: “Shall we reduce the U.S. price to France’s level or stop supplying France? We will stop supplying France.” Novartis CEO Vas Narasimhan has been similarly candid, warning that if the US price cannot sit below the second-lowest price in eight benchmark countries, then some launches in those countries could be delayed or may not happen at all.
And yet, not all ex-US markets create the same degree of risk. That is where the GENEROUS 8 (GENErating cost Reductions fOr US Medicaid) framework becomes so revealing.
GENEROUS 8 launch strategy: An uneven risk landscape
Table 1. Population and GDP-PPP adjustment by market
| Country | Population (2024, mm) | GDP-PPP Adjustment |
| United States | 340.1 | 1.00 |
| Japan | 124.0 | 1.64 |
| United Kingdom | 69.2 | 1.44 |
| Italy | 59.0 | 1.42 |
| France | 68.6 | 1.39 |
| Canada | 41.3 | 1.33 |
| Germany | 83.5 | 1.20 |
| Denmark | 6.0 | 1.02 |
| Switzerland | 9.0 | 1.00 |
| Total | 800.7 |
Table 1 shows the raw building blocks: population and GDP-PPP adjustment factors across the GENEROUS 8 markets. Even before one gets to launch timing or discount architecture, the risk profile is clearly uneven. Japan is large and has a relatively high GDP-PPP adjustment factor. Switzerland is small and, under the current GLOBE and GUARD structure, sits at a 1.0 floor. Those are not equivalent exposures.
A market’s danger to US pricing depends not just on how low its local price is, but on how heavily that price would bite after adjustment - and how much revenue that market offers in return.
Figure 1. GENEROUS 8 Markets by Population and GDP-PPP Adjustment Factor
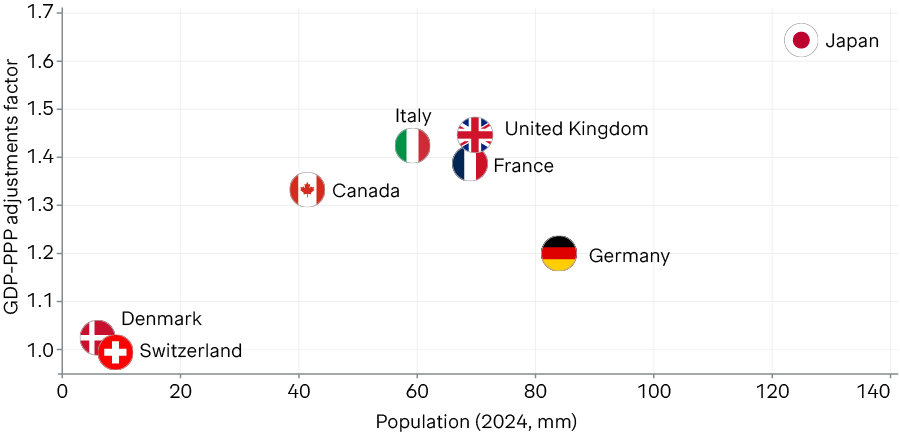
Figure 1 makes the asymmetry obvious. Some markets combine meaningful pricing risk with very modest commercial potential. Others, particularly Japan and Germany, remain too large to ignore commercially, even if they also carry pricing consequences. In an MFN landscape, “global launch” will no longer mean what it used to mean. It will increasingly become an exercise in choosing which foreign revenues are worth the US price decrease they create.
That is the central strategic question manufacturers now face: is it better to launch broadly and accept a lower US net price, or to narrow the footprint and protect the world’s most important profit pool?
Table 2. Comparison of US-only launch revenues vs. 9-market launch after MFN referencing
| Country | Population (2024, mm) | US Only Price | US Only Revenue | Break Even Price | Break Even Revenue |
| United States | 340.1 | 100% | 340.1 | 43% | 146.4 |
| Japan | 124.0 | 0.0 | 42% | 52.1 | |
| United Kingdom | 69.2 | 0.0 | 42% | 29.1 | |
| Italy | 59.0 | 0.0 | 42% | 24.8 | |
| France | 68.6 | 0.0 | 42% | 28.8 | |
| Canada | 41.3 | 0.0 | 42% | 17.4 | |
| Germany | 83.5 | 0.0 | 42% | 35.1 | |
| Denmark | 6.0 | 0.0 | 42% | 2.5 | |
| Switzerland | 9.0 | 0.0 | 42% | 3.8 | |
| Total | 340.1 | 340.1 |
Table 2 gets at that question by asking what ex-US price achievement would be required simply to match the economics of a US-only launch. In the baseline example, the US price falls to the GDP-PPP-adjusted price of Denmark. Under that scenario, the ex-US markets in GENEROUS 8 would need to achieve about 42% of the US price opportunity just to break even versus a US-only strategy (Figure 2).
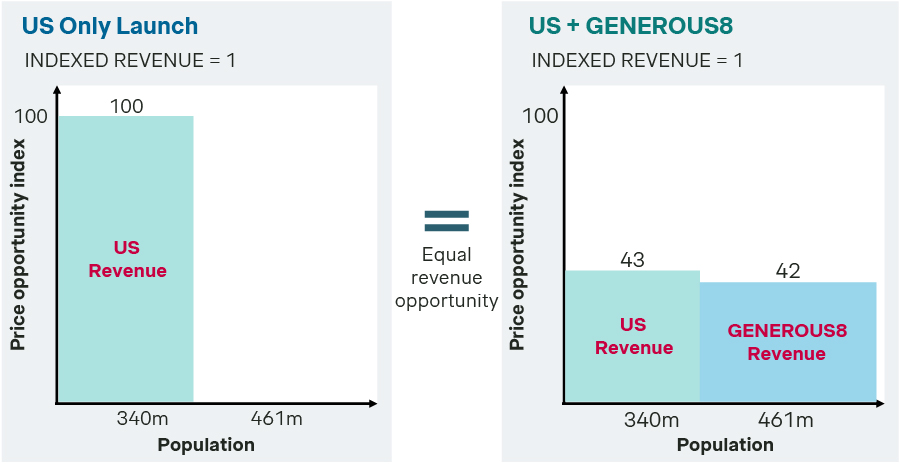
That is a striking threshold. A 58% discount to the US price might sound tolerable in the abstract, but in practice many products in Europe and other ex-US markets still land well below that level. This is before layering in the regulatory, HTA, negotiation, supply-chain, and commercial infrastructure costs required to launch outside the United States.
Table 3. Population as a ratio of the United States and impact on US price after GDP-PPP adjustment
| Country | Population (2024, mm) | Ratio to US | Price relative to US | GDP-PPP Adjustment | Adjusted Price | Impact on US Price if Referenced |
| Japan | 124.0 | 36% | 42% | 1.638 | 69% | 31% |
| United Kingdom | 69.2 | 20% | 42% | 1.438 | 60% | 40% |
| Italy | 59.0 | 17% | 42% | 1.422 | 60% | 40% |
| France | 68.6 | 20% | 42% | 1.385 | 58% | 42% |
| Canada | 41.3 | 12% | 42% | 1.332 | 56% | 44% |
| Germany | 83.5 | 25% | 42% | 1.202 | 50% | 50% |
| Denmark | 6.0 | 2% | 42% | 1.024 | 43% | 57% |
| Switzerland | 9.0 | 3% | 42% | 1.000 | 42% | 58% |
| Switzerland (alt.) | 9.0 | 3% | 42% | 0.921 | 39% | 61% |
Table 3 sharpens the point by showing how differently each market can affect the US price while contributing very different amounts of commercial opportunity. For this analysis, we have assumed the same 42% baseline willingness to pay across the markets. Japan, with a population equal to roughly 36% of the US, has enough scale to matter materially as a revenue generator. Even if Japan were the MFN reference at only 42% of the US price, the GDP-PPP adjustment would imply a relative US price cut of only 31%.
Switzerland sits at the other end of the spectrum. It is only about 3% of the size of the US market, yet the same absolute price opportunity of 42% would imply roughly a 58% relative US price reduction under the current 1.0 floor assumption, and roughly 61% if that floor did not apply. That is a frightening scenario for launch strategy: a small market with disproportionately large consequences.
Why fewer launches sometimes make better economic sense
Table 4. Break-even analysis after MFN referencing compared to a US-only launch with a decreasing GENEROUS 8 footprint
| Country | Baseline Price | Baseline Revenue | Scenario 1 Price | Scenario 1 Revenue | Scenario 2 Price | Scenario 2 Revenue | Scenario 3 Price | Scenario 3 Revenue | Scenario 4 Price | Scenario 4 Revenue | Scenario 5 Price | Scenario 5 Revenue | Scenario 6 Price | Scenario 6 Revenue |
| United States | 43% | 146.4 | 48% | 161.6 | 50% | 171.5 | 57% | 192.3 | 60% | 204.5 | 66% | 224.4 | 74% | 252.2 |
| Japan | 42% | 52.1 | 40% | 49.0 | 38% | 46.9 | 41% | 50.6 | 42% | 52.4 | 46% | 56.9 | 45% | 56.2 |
| United Kingdom | 42% | 29.1 | 40% | 27.4 | 38% | 26.2 | 41% | 28.2 | 42% | 29.3 | 46% | 31.7 | 45% | 31.4 |
| Italy | 42% | 24.8 | 40% | 23.3 | 38% | 22.3 | 41% | 24.1 | 42% | 24.9 | 46% | 27.1 | ||
| France | 42% | 28.8 | 40% | 27.1 | 38% | 26.0 | 41% | 28.0 | 42% | 29.0 | ||||
| Canada | 42% | 17.4 | 40% | 16.3 | 38% | 15.6 | 41% | 16.9 | ||||||
| Germany | 42% | 35.1 | 40% | 33.0 | 38% | 31.6 | ||||||||
| Denmark | 42% | 2.5 | 40% | 2.4 | ||||||||||
| Switzerland | 42% | 3.8 | ||||||||||||
| Total | 340.1 | 340.1 | 340.1 | 340.1 | 340.1 | 340.1 | 340.1 |
Table 4 examines what happens when the launch footprint begins to shrink. As markets come off the table, the MFN reference price moves upward, which improves the US net price. But those markets also disappear as revenue contributors. The tradeoff is dynamic rather than linear.
The most interesting result is that the economics initially improve when Denmark and Switzerland are removed from the launch footprint. In that case, Canada becomes the reference price while Germany remains in the plan, and the break-even ex-US price falls from 42% to 38% of the US opportunity. In other words, there are situations in which launching in fewer countries is not merely defensive but economically smarter.
Table 5. US price impact and volume impact relative to the previous scenario
| Scenario | US Price Reference | US Price Impact | Volume Change |
| Baseline | Denmark | N/A | N/A |
| Scenario 1 | Germany | 10% | -1% |
| Scenario 2 | Canada | 6% | -1% |
| Scenario 3 | France | 12% | -12% |
| Scenario 4 | Italy | 6% | -6% |
| Scenario 5 | United Kingdom | 10% | -12% |
| Scenario 6 | Japan | 13% | -11% |
As Table 5 shows, once too many large markets are removed, the incremental gain in the US net price no longer reliably offsets the revenue lost abroad. The strategy stops being selective pruning and starts becoming economically counterproductive. That is the line every manufacturer will now have to find for each product. It may look very different in oncology than in cardiovascular disease, and very different again in rare disease.
There is also an important unresolved issue that could reshape GENEROUS 8 launch strategy even more dramatically. One of the major unknowns in both the GENEROUS model and the confidential MFN agreements is what happens if a manufacturer launches in only one of the GENEROUS 8 markets. If a “US plus one” strategy escapes MFN adjustment, then launch sequencing becomes even more central to portfolio economics.
Table 6. Break-even analysis after MFN referencing compared to a US + Japan-only launch
| Country | US + Japan Price | US + Japan Revenue | Scenario 7 Price | Scenario 7 Revenue | Scenario 8 Price | Scenario 8 Revenue | Scenario 9 Price | Scenario 9 Revenue | Scenario 10 Price | Scenario 10 Revenue |
| United States | 100% | 349.1 | 100% | 349.1 | 50% | 170.9 | 50% | 175.2 | 58% | 198.9 |
| Japan | 33% | 40.9 | 33% | 40.9 | 33% | 40.9 | 33% | 40.9 | 33% | 40.9 |
| United Kingdom | 0.0 | 0.0 | 50% | 34.8 | 50% | 34.8 | 44% | 30.4 | ||
| Italy | 0.0 | 0.0 | 50% | 29.7 | 50% | 29.7 | 44% | 25.9 | ||
| France | 0.0 | 0.0 | 50% | 34.5 | 50% | 34.5 | 44% | 30.1 | ||
| Canada | 0.0 | 0.0 | 50% | 20.8 | 50% | 20.8 | 44% | 18.1 | ||
| Germany | 0.0 | 0.0 | 50% | 42.0 | 50% | 42.0 | 44% | 36.7 | ||
| Denmark | 0.0 | 0.0 | 50% | 3.0 | 50% | 3.0 | ||||
| Switzerland | 0.0 | 0.0 | 50% | 4.5 | ||||||
| Total | 381.0 | 381.0 | 381.0 | 381.0 | 381.0 |
Table 6 explores exactly that possibility by comparing broader launch strategies to a US + Japan-only benchmark, assuming Japan achieves one-third of the US price opportunity. The result is sobering. To justify launching across the full GENEROUS 8 basket and merely match the revenue from a US + Japan strategy, ex-US markets would need to achieve about 50% of the theoretical US price. Even after removing Denmark and Switzerland, the break-even level only falls to 44%.
This is still an extraordinarily high bar. For most products, under current ex-US valuation frameworks, achieving half the US price opportunity is somewhere between difficult and impossible. The threat to many ex-US markets is not rhetorical but mathematical.
What does this mean for ex-US markets?
That is the part of this debate that payers and policymakers outside the United States have not yet fully absorbed. From a purely commercial standpoint, the smaller GENEROUS 8 markets with low GDP-PPP adjustment factors are the most exposed. They offer modest revenue, but they can create meaningful US pricing damage. If those markets want continued access to the newest innovations, they will need to reconsider how they value them.
That does not necessarily mean all ex-US prices must converge toward historical US levels. That is unrealistic. But it likely means that existing valuation systems—heavily anchored in cost-effectiveness thresholds, external reference pricing, and local comparators—are no longer enough on their own. Some new mechanism will be needed to create room for a subset of truly innovative products to achieve much higher prices than these markets have traditionally tolerated.
One possible answer would be some form of dedicated innovation fund: a ring-fenced mechanism outside normal HTA frameworks that allows markets to reward a limited number of genuinely breakthrough therapies at prices much closer to US levels. This could be something similar to a competitive “innovation prize” model, in which one product in a class earns access to a premium reimbursement pathway based on the totality of clinical and real-world evidence. Whatever the mechanism, the principle would be the same: if the old rules cannot support access in an MFN world, new rules will have to be invented.
That, ultimately, is the real message of the GENEROUS 8 launch strategy analysis. MFN is not just a pricing policy. It is a launch policy, an access policy, and perhaps most importantly, a forcing mechanism. It is forcing manufacturers to rethink geographic sequencing, and it is driving ex-US payers to confront whether they can still expect rapid access to innovation while paying historically low prices.
The challenge for manufacturers is extraordinary. But the challenge for ex-US markets may be even greater. In the pre-MFN world, they could rely on the United States to absorb the commercial burden of innovation. Today, that assumption is no longer safe. And if that assumption breaks, the question will not be whether the global pharmaceutical landscape changes. It will be which countries adapt quickly enough to remain part of it.