
In our previous article we provided a general introduction on ML-based B2B dynamic pricing and its benefits. Now, in Part 2 expert Kiran Pudi answers some common and crucial questions that surface when designing a model.
There are several key design choices and decisions that need to be made when developing a dynamic pricing engine. These decisions have implications for the suitability, flexibility, and robustness of the model. Businesses, therefore, need to set aside sufficient time to consider, test, and validate these decisions.
From our years of experience, we’ve identified critical questions that must be addressed when designing a model. These are important to consider carefully, as they are difficult and costly to change once set. In fact, this is another reason why we emphasize the importance of involving all relevant cross-functional stakeholders early on, as well as throughout the process – from marketing and finance to data science.
Drivers
1. How many drivers should be included in the model?
We recommend between eight and 12. The drivers should represent the full value chain – i.e., upstream raw materials and intermediates, to downstream applications. Customer segments or regions would be other drivers to consider. The drivers shouldn’t be double counted – i.e., multiple drivers shouldn’t represent the same business aspect. For instance, there is limited value in adding capacity, production, and inventory as drivers – rather, two out of the three would suffice.
base model
first, and go
from there
2. Should raw materials be included in the model as a driver or as a reference?
There is no simple answer here. By including raw materials as a driver, there is a risk of inadvertently making it a cost-plus pricing (or markup pricing) model. For certain industries that are highly commoditized, however, a model which excludes raw materials wouldn’t be sufficiently robust. That said, the raw material price could be used as a reference rather than as one of the input variables.
We recommend building the base model without the raw material costs driver. If the base model ends up being under-fitted – that is, if it shows a high mean average percentage error (MAPE) – then raw material costs should be added. Under-fitted models will fail to accurately suggest appropriate price points.
on nature
and
sensitivity
3. Which drivers should be continuous, and which should be discrete?
Whether a driver should be continuous or discrete depends on its nature and how sensitive a price is to a particular driver. Raw material costs, which directly correlate to prices, should be continuous variables rather than discrete. Even a 2 percent change in raw material costs can have significant impact on product price.
Customer segments, volume thresholds, and production levels are good examples of discrete variables, as while price is correlated to these drivers it is not hypersensitive to them.
on the
price driver
4. How many threshold levels should be created for each discrete variable?
The number of thresholds depends on the price driver. For some drivers, like customer segments, we can use natural breakpoints as thresholds. In this case, each customer segment would be a threshold.
For others, e.g. volume brackets, we would have to set threshold values. A typical way is to use quintiles (i.e., 25th, 50th, 75th percentile values) as natural breakpoints. The other approach is to figure out where the average price is changing and use that as a breakpoint. There is no need to have intervals of equal length, rather the breakpoints should be set where the average price, or the drivers, are changing. To make the model more granular, we can choose deciles over quintiles.
20% testing
5. How should data be divided between test and train?
As a good starting place, we recommend using the last three to five years of data for regression. Below are some further best practice tips:
First, the granularity of data should be consistent (e.g., by week or by month) across all chosen price drivers. Second, it’s best to avoid time frames when the market was disrupted by exceptional or black-swan events. For instance, for 2019 to 2023 data it will be important to consider removing the COVID years. Once data is chosen and gathered, 80 percent is typically used for training the model (i.e., four out of every five years) and the remaining 20 percent for testing (i.e., one out of every five years).
It’s worth noting that training and test data doesn’t need to be chronological. For instance, the test data can come from 20 percent of the transactions that are spread throughout the five years.
on
business
objectives
6. Which algorithm to use and why?
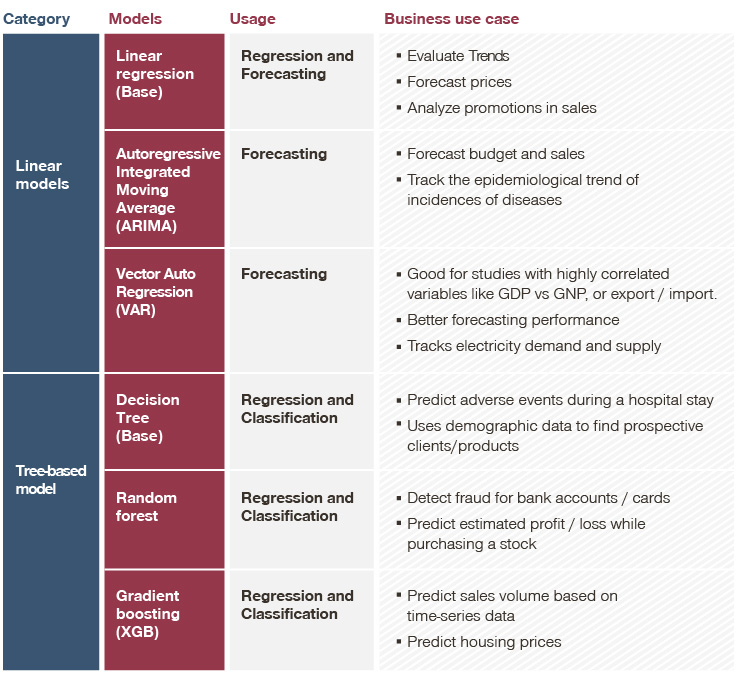
There are a number of algorithms to choose from when developing a dynamic pricing model. Which one you choose depends on your business agenda and objectives. A simple linear regression model would be easy to maintain and explain to the wider team. More sophisticated models, like random forest, can be used to generate prices but are harder to explain to sales, and so impact the buy-in. These could, therefore, end up becoming black box and challenging to maintain.
Below is a table detailing linear and tree-based models and their various uses. Bear in mind that different models can also be combined to obtain better results and error rates.
and
business KPIs
7. How to evaluate the performance of a model for a dynamic pricing engine?
Statistical KPIs depend on which ML model the dynamic pricing engine is built on. For linear regression models, R-squared (R2) and MAPE are the two major KPIs to check. R2 is used to explain the correlation between dependent and independent variables. MAPE, on the other hand, is used to calculate the error rate.
Customer segments, volume thresholds, and production levels are good examples of discrete variables, as while price is correlated to these drivers it is not hypersensitive to them.
On the business side, to understand how well a model is performing, factors like revenue impact, price changes at product and customer levels, as well as price gaps when comparing to real and market prices, are all important to check.
We helped our client make more effective decisions through their entire value chain, from forecasting feedstock prices to improving their commercial strategy
Key Takeaways
Clearly, there are many questions to consider when building and designing a B2B dynamic pricing model. The key is to ensure that all stakeholders are part of the decision-making process so that the model can best work for your business objectives.
Having looked at some of the mechanisms behind dynamic pricing, in the following article we will address change management challenges that may arise. Part 3 will look at why businesses need to commit to change management if they wish to run a successful dynamic pricing tool.
The questions covered in this article are only a few of the many decisions that must be considered when designing a dynamic pricing model. To find out all the other decisions required and how to tackle them, please reach out to our experts.
Read more from the series:
- Part 1: Introduction to B2B Dynamic Pricing
- Part 3: Seven Solutions to Change Management Challenges in B2B Dynamic Pricing