
Health spending, clinical capacity, and financial protection differ sharply across Asia. Those differences change where hospital capital is likely to create value.
Hospital investment decisions in Asia sit inside health systems with very different resource bases.
Asia has consistently been seen as a major driver of healthcare growth over the next decade. Providers are already positioning for that opportunity by expanding capacity, investing in advanced diagnostics and digital infrastructure, and building more sophisticated specialist offerings to capture rising demand. Across markets such as India, Indonesia, Thailand, Malaysia, and Singapore, this growth is taking different forms – from new beds and integrated digital systems to international patient pathways, AI-enabled workflows, and complex-care capabilities.
Yet, beneath this common growth agenda sit health systems with fundamentally different starting points. In the lower-resource markets we analyzed, median healthcare spending is about $289 per person on a purchasing-power-adjusted basis. In mature systems it approaches $4,700, more than 15 times that of lower-resource systems. Physician availability rises from roughly 0.8 to 2.6 per 1,000 people, while household exposure to healthcare costs generally falls.
This variation has a direct implication for capital allocation: investors cannot apply the same growth playbook across Asia. The practical question for investors and hospital leaders is where the next dollar will do the most to improve performance.
Exhibit 1 | Resource conditions differ materially across selected markets
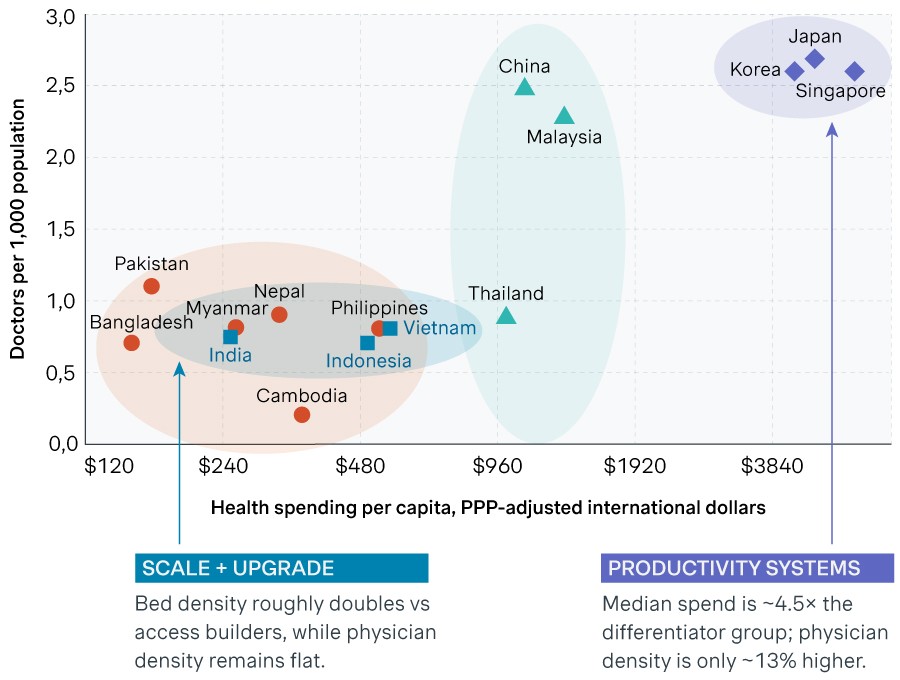
Source: OECD/WHO, Health at a Glance: Asia/Pacific 2024
To translate these differences into clear capital-allocation priorities, we organize markets into four archetypes: access builders, scale-and-upgrade systems, differentiators, and productivity systems. Each reflects a different combination of health-system resources, effective capacity, affordability, and clinical workforce depth – and, critically, a different constraint on growth. The framework helps investors identify what is limiting performance in each market, and therefore where the next dollar of investment is most likely to create value.
Exhibit 2 | Four hospital economies, four different capital-allocation considerations
| Access builders | Scale + upgrade |
|---|---|
| $289 Spend PPP | $483 Spend PPP |
| 0.8 Doctors / 1k | 0.7 Doctors / 1k |
| 0.8 Beds / 1k | 1.6 Beds / 1k |
| 56% OOP share | ~40% OOP share |
Typical markets Bangladesh, Cambodia, Myanmar, Nepal, Pakistan, Philippines | Typical markets India, Indonesia, Vietnam |
Archetype characteristics Low spending, bed and physician density; high household exposure.[1] | Archetype characteristics Bed density rises while physician density remains broadly flat across the group.[1] |
| Key investment question | Key investment question |
| How much usable supply can the investment add? | Will new capacity carry enough clinical depth? |
| Key aim: Expand and connect | Key aim: Build and upgrade |
What others have done Makati and Bicol document access, integration and information-flow initiatives. [2] [3] | What others have done PSN India, SATUSEHAT, Apollo and ABDM document concurrent physical and digital expansion. [4]–[7] |
| Differentiators | Productivity systems |
|---|---|
| $1,033 Spend PPP | $4,676 Spend PPP |
| 2.3 Doctors / 1k | 2.6 Doctors / 1k |
| 2.3 Beds / 1k | Varies Beds / 1k |
| ~32% OOP share | ~22% OOP share |
Typical markets China, Malaysia, Thailand | Typical markets Japan, Korea, Singapore |
Archetype characteristics Higher spending and physician density than the scale-and-upgrade group.[1] | Archetype characteristics Spending rises much faster than physician density relative to differentiators.[1] |
| Key investment question | Key investment question |
| Will the investment deepen a clinical position? | Will it release scarce clinical capacity? |
| Key aim: Concentrate clinical depth | Key aim: Improve productivity |
What others have done Thailand and Malaysia policy sources document healthcare-travel strategies; Phyathai documents an international-patient pathway. [8]–[10] | What others have done Japan and Singapore sources document complex-care and productivity-oriented initiatives. [11]–[13] |
ARCHETYPE 1
Access builders
Expanding effective supply
Access-builder markets are defined by a combination of limited healthcare capacity, constrained clinical workforces, and high patient healthcare affordability barriers. Across Bangladesh, Cambodia, Myanmar, Nepal, Pakistan, and the Philippines, median health expenditure is approximately $289 per person, with only around 0.8 doctors and 0.8 hospital beds per 1,000 people. Households typically pay more than half of healthcare spending directly. Low bed and physician densities indicate a thin supply base, while the high out-of-pocket share adds an affordability constraint.
The Philippines illustrates this clearly: health expenditure is approximately $522 per person, yet the country has only around one hospital bed and 0.8 doctors per 1,000 people, and roughly 42% of healthcare spending is out of pocket. In this environment, physical infrastructure is only one part of the access equation. Diagnostics, referrals, appointment systems, medical records, and patient navigation all influence whether existing clinical capacity can be reached and used effectively.
Recent investments in Makati and Bicol Medical Centers show how providers are beginning to address these broader access constraints. In June 2025, the Philippine Information Agency reported that Makati hads launched an integrated health system that connects appointments, teleconsultations, diagnostics, and electronic medical records, supported by more than PHP 3.47 billion of investment in digital infrastructure and services. Bicol Medical Center has similarly integrated outpatient and emergency care with laboratory, pharmacy, radiology, billing, and discharge workflows, resulting in improved staff coordination and reduced patient waiting time.
While public evidence does not yet show the system-wide impact of these initiatives, they point to an important feature of the access-builder archetype: integration can be as important as physical expansion in increasing effective capacity.
INVESTMENT IMPLICATION: Integration is part of effective capacity
Prioritize limitations that most constrain usable access. Additional beds and facilities may be necessary, but diagnostics, referrals, and information continuity can be equally important where existing capacity is underutilized.
ARCHETYPE 2
Scale and upgrade
Capacity growth begins to outpace clinical depth
Scale-and-upgrade markets are characterized by a dual challenge: physical capacity still needs to expand, but the clinical capabilities required to make that capacity productive are becoming harder to build at the same pace. Across India, Indonesia, and Vietnam, median bed density is around 1.6 per 1,000 people – roughly double that of access-builder markets, yet physician density remains close to 0.7 per 1,000 – clearly indicating a growing gap between capacity and actual medical care.
This creates an important asymmetry for investors. Hospitals can often be financed and built faster than specialist workforces can be trained, recruited, and integrated into effective care pathways. As a result, the investment challenge begins to shift from simply adding beds to ensuring that new capacity can be effectively utilized.
Indonesia has around 1.4 hospital beds and 0.7 doctors per 1,000 people. Providers and policymakers are investing in the infrastructure needed to make existing capacity more productive. In October 2025, RS Pondok Indah reported that all three of its hospitals had reached HIMSS EMRAM Stage 7, covering areas including electronic-record use, information-system integration, and connected medical devices. In July 2026, Indonesia's Ministry of Health also announced measures to accelerate electronic medical records integrated with SATUSEHAT for JKN claims management. These measures show the type of infrastructure required as hospital networks scale to bridge the clinical and capacity gap.
India faces the same tension at much larger scale. National health expenditure is approximately $236 per person, with around 0.7 doctors and 1.6 hospital beds per 1,000 people. To bridge this gap, both private providers and the public sector are investing in the digital and clinical infrastructure needed to make expanding capacity more productive. Apollo Hospitals has disclosed plans to add approximately 4,370 beds over three to four years while continuing to invest in advanced diagnostics and digital care.
At the same time, the Ayushman Bharat Digital Mission is building a national digital layer: by July 2026, it had created 948.7 million Ayushman Bharat Health Accounts and registered around 536,000 healthcare facilities and 1.01 million healthcare professionals. Together, these initiatives show India’s efforts to expand capacity while strengthening the infrastructure needed to connect patients, providers, and services more effectively.
INVESTMENT IMPLICATION: Capacity planning needs to incorporate clinical and referral capability
Assess whether clinician availability, referral flows, diagnostics, and digital integration can scale alongside the physical asset. The value of additional capacity depends not only on what is built, but on whether the broader clinical ecosystem can support its use.
ARCHETYPE 3
Differentiators
Clinical depth shifts competition toward specialist franchises
Differentiator markets have a more developed healthcare resource base, where competition increasingly shifts from adding capacity to building distinctive clinical positions. Across China, Malaysia, and Thailand, median health expenditure rises to approximately $1,033 per person, while physician density reaches around 2.3 per 1,000 people. With greater clinical depth already in place, hospitals need to compete on where they can build specialist capabilities and attract more complex cases.
Building a strong position in a specialty requires clinician depth and supporting patient services that reinforce one another over time, not just equipment or beds. These capabilities can help build complex case volumes and improve utilization of high-cost assets.
Thailand’s differentiation shows up in international care. Government materials published in 2024 set out a 2025–2034 Medical Hub strategy aimed at strengthening service capability, the medical-industry ecosystem, and international market development. At the provider level, Phyathai 2 publishes an international patient pathway spanning pre-arrival coordination, treatment planning, insurance and direct billing, multidisciplinary care, and post-treatment follow-up.
Malaysia provides a second policy-backed example. In December 2025, Tourism Malaysia and the Malaysia Healthcare Travel Council (MHTC) announced a formal cooperation agreement linked to Visit Malaysia 2026 and the Malaysia Year of Medical Tourism 2026. The announcement identifies medical tourism as a priority segment and notes that MHTC represented 80 member hospitals nationwide. These examples demonstrate deliberate efforts to strengthen healthcare travel and differentiated service propositions.
INVESTMENT IMPLICATION: Differentiation depends on an integrated clinical proposition
Concentrate capital where specialties have sufficient clinician depth, diagnostic capability, referral flows, and multidisciplinary pathways to attract and retain case volume. The value of investment depends on whether these capabilities reinforce one another strongly enough to improve clinical differentiation and asset utilization.
ARCHETYPE 4
Productivity systems
Experienced clinical labor becomes relatively harder to expand
Productivity-system markets have high healthcare spending and substantial installed capacity, but a comparatively smaller clinical workforce. Across Japan, Korea, and Singapore, median health expenditure is approximately $4,676 per person – more than four times the differentiator group – while physician density rises only modestly, from around 2.3 to 2.6 per 1,000 people. These figures indicate that getting more output from existing clinicians and assets becomes a more important investment consideration as systems mature.
Here, adding more physical capacity may generate less incremental value than improving the productivity of existing capacity. The focus moves toward releasing clinician time, increasing throughput, improving workflow, and deploying scarce clinical resources toward higher-value or more complex care. Investments in AI, automation, digital workflow, and advanced treatment capabilities become relevant where they can create effective operating capacity without requiring a proportional increase in beds or workforce.
Japan has more than 12 hospital beds per 1,000 people. Shonan Kamakura General Hospital offers specialized therapies such as proton-beam therapy, for which it reported over 140 new patients in 2024. In this case, capital goes into complex treatment capability within a market where physical capacity is already extensive.
In Singapore, the Ministry of Health reported in April 2026 that SingHealth's Note Buddy had helped healthcare workers across all public healthcare institutions and clusters generate more than 80,000 medical and administrative notes, with the stated aim of releasing time for patient care. Robotic-assisted surgical systems have also been deployed across major public hospitals, with potential benefits cited for staff workload and operational efficiency. These initiatives illustrate how technology can target workflow and clinician capacity directly.
INVESTMENT IMPLICATION: Productivity depends on creating more operating capacity from existing resources
Test each investment against the operating capacity it creates, not the physical capacity it adds. Assess whether it can release clinician time, increase throughput, or improve utilization of the installed asset base. Measure success through indicators such as clinician time saved and cases handled per clinician or asset, and compare the gains with the returns from adding further physical capacity.
How the hospital investment test changes between archetypes
The four archetypes identify the constraint currently limiting growth, and therefore what incremental capital needs to achieve. Investments should be assessed against that constraint, rather than the attractiveness of the asset or technology in isolation.
The same investment can create value in different ways. An AI workflow tool in a mature hospital may be justified by clinician time saved or higher throughput; in an access-constrained network, the relevant outcome may be faster diagnostics, better record availability, or improved referral completion. The technology may be the same, but the healthcare investment case and success measures differ.
As investments mature, operating indicators such as facility ramp-up, specialist vacancies, referral concentration, case mix, clinician utilization, and high-cost asset utilization can further test whether the identified constraint is still the right one – and whether the investment logic needs to change.
An investment case should therefore make three elements explicit: the constraint being addressed, the operating metric expected to change, and the economic value attached to that improvement. Success should be measured against that metric after deployment, rather than inferred from implementation alone.
Exhibit 3 | Operating indicators can show when the economics around an asset are changing
| Operating signal | Possible interpretation | What management should test |
|---|---|---|
New facilities take longer to reach target utilization | Physical capacity may no longer be the only factor limiting ramp-up. | Specialist depth, referral flows, payer mix and patient access by catchment. |
Specialist vacancies persist despite available space | Clinical workforce may be harder to expand than the physical asset base. | Recruitment lead times, retention, scheduling productivity and service-line design. |
Referrals concentrate in a small number of programmes | Clinical reputation and specialty depth may be carrying more of the competitive load. | Referral sources, case-mix concentration, physician networks and programme economics. |
Ambulatory or day-care activity grows faster than inpatient volume | Demand may be shifting toward less bed-intensive delivery models. | Asset mix, site-of-care economics, conversion opportunities and inpatient utilization. |
High-cost assets remain underused despite healthy demand elsewhere | Workflow, referral architecture or case density may be limiting returns. | Throughput, referral leakage, scheduling, case eligibility and alternative uses of capital. |
Exhibit 4 | Investment criteria by archetype
| Access builders | ||
|---|---|---|
| Does this create usable healthcare capacity? | Measures |
|
| Scale + upgrade | ||
| Will new capacity remain competitive as supply deepens? | Measures |
|
| Differentiators | ||
| Does this strengthen a clinical position? | Measures |
|
| Productivity systems | ||
| Does this release scarce clinical resources? | Measures |
|
Regional portfolios should be evaluated one asset at a time
For investors backing multi-market hospital groups, the archetypes are most useful as a portfolio-allocation lens rather than as a country classification. Hospitals on the same platform can face very different constraints depending on catchment, competitive position, specialty mix, workforce depth, and stage of development.
One hospital may still require capital to expand access and strengthen referrals, while another in the same group may already need to deepen specialist capabilities or improve productivity from an established asset base. Applying the same investment logic across the portfolio risks allocating capital to assets where the original constraint no longer applies.
Country-level indicators should therefore serve as a starting point for diligence, not the investment prescription itself. Capital allocation should be tested at asset and specialty level to identify the binding constraint and what additional healthcare infrastructure investment would change.
Reassessing the healthcare investment logic
For each major asset, three questions provide a practical test:
1. What resource is limiting performance today?
Identify the current bottleneck – whether access, physical capacity, physician shortage, specialist capability, workflow, or utilization of existing assets.
2. How is that constraint likely to change over the life of the investment?
Consider whether planned capacity additions, workforce development, technology adoption, competitive activity, or changes in referral patterns could ease one constraint and cause another to become more important.
3. Does the next dollar of capital still address the right problem?
Compare the proposed investment with alternative uses of capital based on the operating outcome each can create, not simply on whether the asset has historically generated growth.
Asking these questions while performance is still strong gives investors greater flexibility to redirect capital before declining marginal returns make that decision more difficult.
At Simon-Kucher, we leverage our deep expertise in healthcare providers, local market dynamics, and growth-driven value creation to help investors identify where capital will have the greatest impact across their hospital portfolios. To explore how this framework applies to your portfolio, reach out to our Healthcare & Life Sciences team.