When it comes to understanding the importance of pricing, our five important analysis methods can be eye-openers for Management. They show you where immediate action is needed, and, if the right steps are taken, will have a direct impact on your profits. To emphasize: We mean profit, not revenue. Most KPIs, dashboards and cockpits indicate the revenue figures, sales volume and in the best cases some aggregated margins on a country or product level. However, to draw meaningful conclusions you have to dig one level deeper. Use our analyses to reveal profit potential in places you haven’t looked until now:
#1 Customer analysis
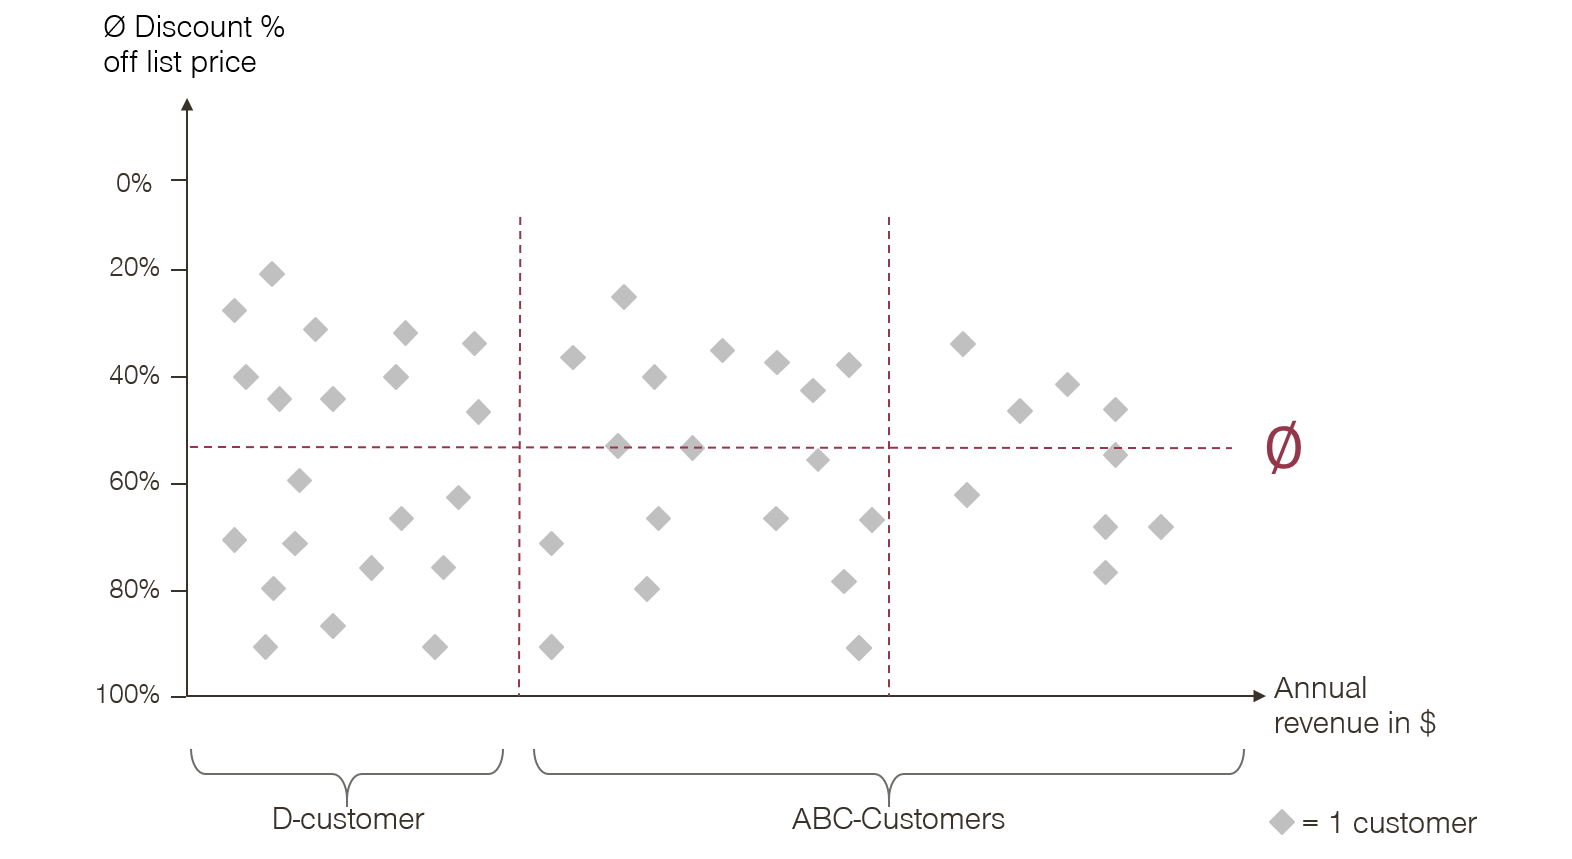
A very basic analysis, that’s conducted by very few companies. This analyses annual revenue using the average margin or discount for all of your customers. Typically you would expect higher revenue to lead to a higher discount (and lower margin). But in reality, this is what we very often encounter:

This is risky business. Big customers might buy out one of the smaller customers with a higher average discount and inevitably wonder why you didn’t offer them the better price. A consistent pricing strategy would avoid that risk, and is also much fairer from a customer perspective. Now you could argue that the product mix is very different for each customer, resulting in such deviated margins. You’re right. This is just a starting point to identify outliers where a price increase is necessary. For a more in-depth analysis, we have to go to our next method.
#2 Price Cube analysis
Since it’s not fair to compare margins for machines to those of spare parts, key accounts to C-customers or first world countries to developing countries, we have to go one level deeper. For this we use the “Price Cube” analysis. The idea is to compare transactions with the same or at least very similar margin expectations. You pick one product, application, customer type and region, and start comparing margins for these transactions only. Once the data is correctly arranged, the results are striking.

Margins are all over the place. Deviations of 30%-50% are the norm, not the exception. One simple solution is to move all C-customers with a below-average margin to the average margin level or above. This creates significant profit potential, and bears low risk. If you manage to move some or your B- or A-customers too, the results will be even more impressive.
#3 Secondary products vs. primary products
There are certain products that are more strongly in the customer focus – primary products, and others which fall under the radar – secondary products. The common behaviour of customers is to compare the prices of primary products, because this is where they spend the majority of their money. This means that here you need a very competitive price. On the other hand, customers don’t pay attention to secondary products, giving you room to play with their prices.

Finding out which products are in focus and which have low sales volumes and revenues can help you to steer your prices. The untapped profit potential lies in the secondary products. Using low price knowledge and interest in these products to your advantage can be very profitable.
#4 Discount frequencies
The next important analysis focusses on the granted discount frequency. Is your sales team using the full range of percentages? You will be amazed how often discounts are granted in psychological steps of 10%, 15%, 20% and so on. Customers get used to this behaviour and know to ask for the next 5% discount in the following negotiation round.

Let’s say you offer a 20% discount and the customer asks for more. Every time the sales rep doesn’t fight for 21%, 22% or 23%, and immediately grants the 25% discount, a lot of money is left on the table. The best way to change this behaviour is to link discounts with sales incentives, bringing us to our last analysis.
#5 Profits per sales reps
Analysing the profit per sales representative is very simple but also highly political method. Although rather easy to compute, such an analysis can have a very strong impact when used in the right way. The left side of the table below shows the typical way to rank sales reps. The rep who sells the most is king. But shouldn’t profit be at least just as important as revenue?

On the right side, you see the ranking if absolute profit contribution is the main driver. Isn’t that the better ranking? We are aware that in some industries you have high fixed costs and need volume in order to be profitable. But selling purely based on price is the dullest way to sell. Creating incentives for sales reps to sell value should always be part of the equation.
These five methods will help you to identify:
Customers with below-average margins
Transactions with below-average margins
Price levels for primary and secondary products
The frequency of granted discounts at psychological steps
Revenue-driven vs. profit-driven sales reps
Use these analyses and successfully boost your profits!


