
What does it take to transform analytics from a reporting function into a driver of real commercial impact? In this article, we explore the final pillar of our RMS framework – monitoring – and how it enables timely insights, better control, and informed pricing and contract decisions in the medtech industry.
Intuitively, every medtech company understands that data and analytics are critical for both growth and daily operations. Yet, many struggle to leverage their Revenue Management Systems (RMS) fully, as data accuracy remains a persistent concern.
Worse still, many firms often lack a systematic approach to incorporate analytics into decision-making. As a result, they invest heavily in data and analytics without ever feeling truly data driven. As the late Hubert Oesterle famously observed, the biggest impediment to digital transformation is the mismatch between people’s ambitions for data and their trust in it.
In this fourth article of our series, we examine the final pillar of our RMS framework – monitoring – and show how reliable data can continuously steer pricing, contracts, and overall commercial performance.
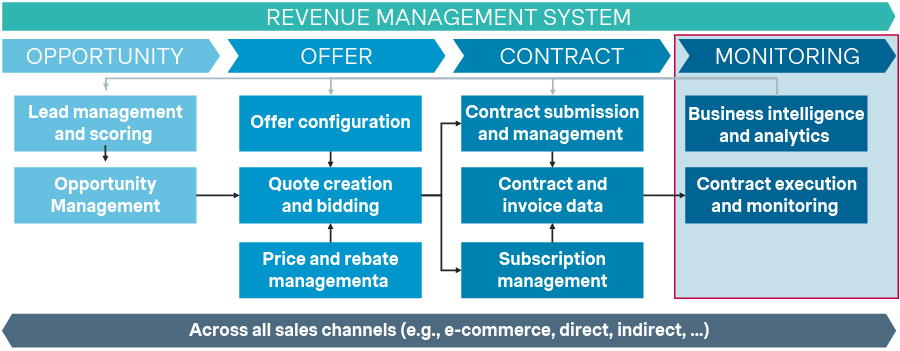
Figure 1: End-to-end revenue management system framework
Challenges
Even the most advanced RMS can underperform without a structured, end-to-end approach to analytics and monitoring. Companies may aim to become data-driven but often face internal barriers.
1. Cracks in the data foundation
- Data disorder: Core data fields are scattered across disconnected systems with incompatible schemas. Key commercial data like procedure codes, rebate clauses, and freight surcharges exist in half-a-dozen applications, each using different customer IDs. Analysts must manually reconcile spreadsheets to assemble a baseline, yet managers question the outcome.
- Ownership vacuum: No one owns the full data chain. Logistics tweaks freight, Pricing adjusts discounts, and Finance changes invoice logic, without coordinating or alerting downstream users. Minor fixes snowball into “system issues”, triggering inefficient workarounds.
- Context blind spots: Valuable insights like competitor pricing, tender outcomes, and distributor sell-out data often remain trapped in laptops, inboxes, or unshared spreadsheets. As a result, algorithms explain what happened but cannot reveal why, leaving leaders to rely on anecdote.
2. Sluggish insight-to-action cycle
- Reporting lag: When insights surface only after Finance closes the books, frontline decisions are made before issues like margin leakage are flagged, leaving no time for course correction.
- Tool detours: Analytics outside the user’s normal workflow are ignored under time pressure. If a salesperson must log into a separate BI portal, re-authenticate, and reinterpret a metric, “real-time” advice becomes irrelevant; the model never influences the deal.
- Fragmented metrics: Inconsistent metric definitions stall decisions. When global dashboards, regional files, and local ERPs disagree, leaders hesitate, often missing the pricing window.
3. Unstable analytics culture
- Analytics-translation gap: Sales teams seldom receive training that links analytical concepts (e.g., confidence intervals, price-elasticity curves) to their revenue or bonus targets. Across deals, these gaps quietly shave points off margin.
- Dashboard duplication and distrust: A lack of clear ownership results in redundant dashboards with conflicting insights. Centralized reporting can alienate local teams, resulting in duplication, conflicting metrics, and no unified view. Yet full decentralization leads to disjointed views and missed opportunities.
- Change fatigue: Previous analytics initiatives over-promised and under-delivered, creating skepticism. Without quick, visible wins, new efforts struggle to gain traction no matter how compelling the technology.
Most firms react by throwing money at the symptoms – new licenses, more dashboards, extra data scientists – only to discover they are no closer to a reliable, end-to-end insight engine. Real progress demands a structured approach combining data integrity, workflow integration, and behavioral change. Without it, even the most advanced RMS risks becoming underused and ineffective.
Benefits
Medtech companies understand the challenges and have already established teams to drive analytics. Yet, many lack the mandate, tools, or structure to deliver real value. Becoming an insight-driven company offers many benefits, such as:
1. Improved efficiency of process through
- Task automation: Analytics can automate repetitive tasks like data entry, report generation, and contract monitoring, freeing teams to focus on strategic activities. For example, an analytics-driven RMS can automatically generate and distribute insights to relevant stakeholders.
- Streamlined workflows: Integrating analytics into core processes minimizes delays. For example, in CPQ, it can automatically score deals based on historical data, enabling sales teams to prioritize high-margin opportunities.
- Structured analytics organization: Eliminating duplicated work and clarifying roles across teams boosts efficiency. Standardized data sources and aligned processes build trust, improve collaboration, and accelerate decision-making.
2. Increase the bottom-line by
- Optimizing pricing: Analytics helps optimize pricing by responding to real-time customer behavior, competitive benchmarks, and historical trends. In CPQ, analytics can recommend optimal and competitive pricing for each deal, maximizing profitability. In PO&M, it informs targeted promotions to boost sales while minimizing storage costs.
- Preventing revenue leakage: Analytics can help identify discrepancies in contract terms, rebates, or pricing arrangements. For instance, alerts can be set to ensure price increase are applied once volume thresholds are met.
- Increasing win rates: Scraping and analyzing publicly available data (like past tender results) reveals which pricing and contract strategies work best. Win/insights create a powerful feedback loop to refine future bids.
3. Faster, smarter decision-making through
- Reduced errors: Automated analytics ensures data accuracy, consistency, and real-time validation across systems. For example, in rebate management, it flags discrepancies before payouts, reducing costly overpayments and disputes.
- Data-driven negotiation: Teams can negotiate more effectively by leveraging data on market trends, historical deal performance, and competitor benchmarks. By identifying patterns in pricing, discounts, and contract terms, it enables better terms, profitability, and stronger strategic relationships.
But there is more. With the right insights, companies can unlock entirely new revenue streams by monetizing existing data. For instance, anonymized usage data drives paid subscription models or integrates services you never previously considered. Find out more in this article by our colleagues.
Journey to analytics excellence
Despite significant investments in data and analytics, many medtech companies still struggle to achieve truly data-driven decision-making. Disconnected initiatives, siloed data, and insufficient stakeholder engagement often limit impact. A structured, phased approach that aligns analytics capabilities to business needs can change this trajectory.
Our framework includes three key steps:
- Set foundations for data quality and governance
- Embed analytics into people, processes, and tools
- Automate & accelerate using AI-driven insights and streamlined workflows.
This sequence builds a sustainable, scalable analytics ecosystem that delivers real business value.
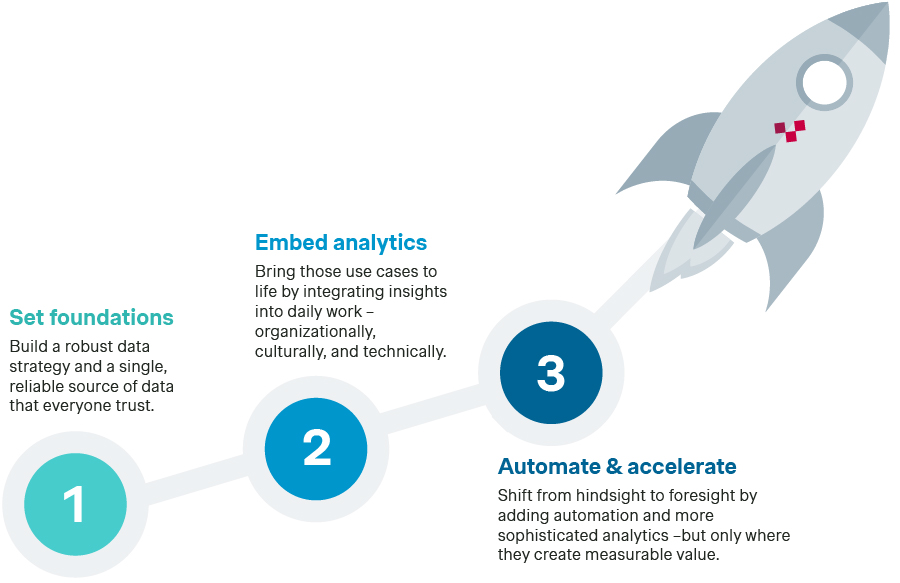
Figure 2: Journey to analytics excellence
1. Set foundations
Jumping into advanced analytics without clear strategy or reliable data leads to fragmented efforts and skepticism. A solid foundation ensures analytics initiatives serve real business needs and rest on consistent, well-governed information.
1.1. Define your data strategy
Begin with a simple question: “Which business problems will analytics actually solve?” Avoid metric overload by prioritizing real use cases across six categories – each one familiar to commercial and operations leaders across medtech.
- Strategic: Identify market trends, assess competitive positioning, inform long-term business strategies.
- Operational efficiency: Optimize internal processes, reduce costs, improve productivity.
- Customer-centric: Personalize interactions, predict needs, and improve satisfaction.
- Risk & compliance: Mitigate risks and ensure regulatory compliance by monitoring data for anomalies.
- Financial & revenue optimization: Improve pricing, reduce leakage, and forecast accurately.
- Product & service innovation: Drive innovation by identifying customer needs, testing new ideas, and improving existing offering.
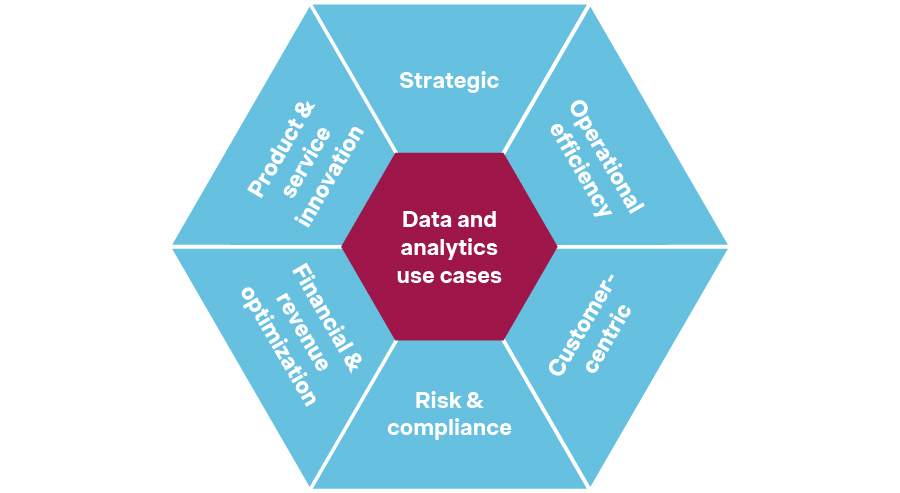
Figure 3: Data and analytics use cases
These use cases map directly to the three pillars of our RMS framework – Opportunity, Offer, and Contract – because each pillar hosts its own set of decisions and requires targeted insights. For instance, analytics can rank prospects in opportunity management, optimize discounting in offer management, and flag volume-triggered price changes in contract management.
Use case types | Opportunity | Offer | Contract |
Strategic | Market-potential heat map pinpoints fastest-growing procedure segments | Discount-elasticity curve shows how win probability shifts at each band | Renewal dashboard projects upcoming revenue by contract tier |
Operational efficiency | Lead scoring based on win-rate history pinpoints high-conversion prospects | Quote-cycle dashboard identifies proposal bottlenecks | OCR extracts key terms and auto-fills CLM fields |
Customer-centric | Purchase-pattern clustering reveals responsiveness to training-device bundles | Recommend additional products or services based on purchase history | Usage forecast triggers upsell call before consumables run out |
Risk & compliance | Win-probability model flags tenders at risk using past success drivers and competition | Benchmarks, customer insights, and risk indicators to guide decisions | Volume monitor tags unmet commitments for rebate claw-back |
Financial & revenue optimization | Early-revenue projection flag likely deal closures and margin impact quarterly | Price comparison vs. prior deals ensures consistency and transparency | Margin-leak tracker checks that agreed price escalators are invoiced |
Product & service innovation | Procedure-mix analysis reveals product and service demand trends | Offer-variant dashboard compares uptake performance of financing offers | Post-install usage analytics reveal feature gaps for the next device release |
Sidebar 1: Exemplary RMS use cases
The next move is to anchor each use directly to a specific point in the commercial workflow, such as the “price” step in a quoting process. Once mapped, the required data elements, users, intended decisions, and needed data granularity becomes clear. These define stewardship, update frequency, and quality standards.
Progressing from pillar idea → process step → data & governance keeps the strategy rooted in daily operations, eliminates ad-hoc dashboards, and ensures clear accountability. This approach also curbs uncoordinated “analytics experiments,” enabling teams to follow a unified roadmap to build data maturity.
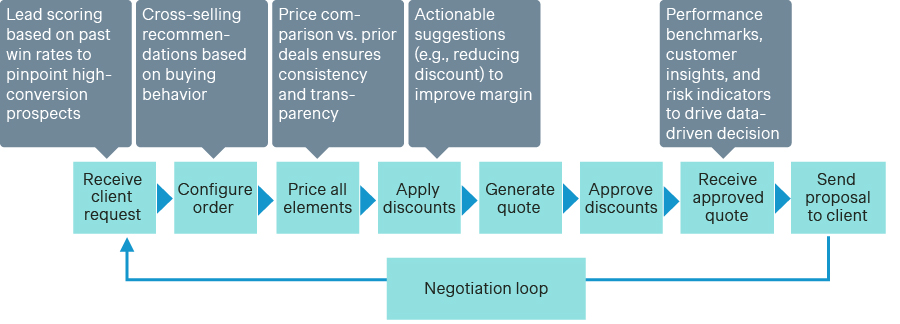
Figure 4: Exemplary quoting process use cases
We recommend reading our data strategy article for an in-depth look at how to develop and scale your data strategy.
1.2. Build your single source of truth
After strategy comes infrastructure: a centralized, trusted data environment. Whether via a data warehouse, lake, or system integration, this ensures all teams work from the same numbers.
First, identify the data sources required for your top use cases. Then, define how they are collated, validated, and standardized. This might include lost-deal forms or external data ingestion pipelines. Governance rules (covering quality checks, update timing, and access) preserve transparency and accountability.
This shared data foundation supports consistent, credible analytics across the organization, saving time and fostering cross-functional trust.
2. Embed analytics in your organization
Solid data and a single source of truth set the stage, but real value emerges only when insights become part of everyday work. Embedding analytics ensures that the right people receive the right information the moment a decision is made – whether that is a sales rep preparing a quote, a contracts manager validating rebates, or an executive monitoring margin leakage.
2.1. People
Vague ownership leads to redundancy and mistrust. Firms often centralize too much (losing local relevance) or decentralize entirely (breeding inconsistency). A hybrid operating model works best, with a Center of Excellence (CoE) managing standards and local analysts tailoring insights.
Clearly defined roles and a concise RACI matrix ensure accountability. Training, role-based coaching, and leadership sponsorship boost adoption. When teams understand both the meaning and ownership of insights, analytics becomes a core business capability.
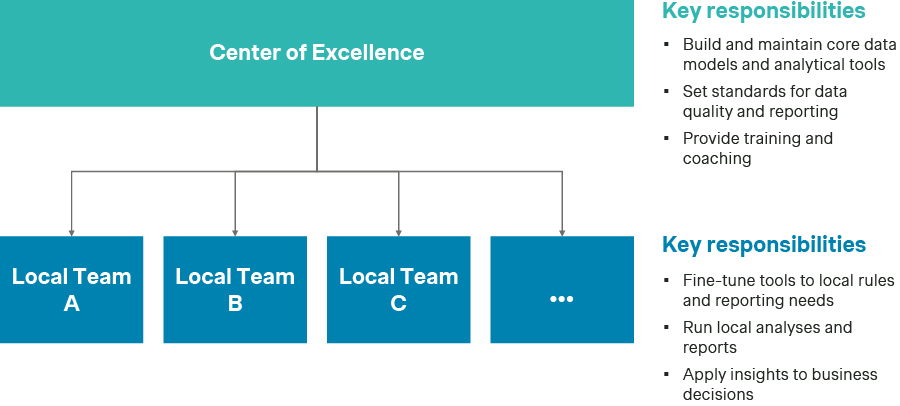
Figure 5: Holistic overview of an exemplary hybrid analytics governance model
2.2. Processes
Align analytics not just to decisions but to underlying data processes that enable them. Instead of changing how teams quote or approve deals, the focus should be on how data flows through each step.
For example, if deal scoring is automated, define what data feeds the model, who ensures input quality, and when alerts are triggered.
Small changes, like tracking reasons for lost deals fill key data gaps. Embedding analytics into existing workflows, rather than replacing them, ensures insights are reliable, timely, and actionable.
2.3. Tools
Choosing the right tools is critical to analytics success. For daily decision-making, the most effective approach is to embed analytics into the systems users already rely on. For example, if sales team uses a CRM platform, insights like purchase history, recommended discounts, or deal forecasts should appear directly within that interface. This integration minimizes friction, drives adoption, and supports real-time decision-making.
At the same time, broader strategic require business intelligence (BI) platforms like Tableau or Power BI, which offer dashboards, reporting tools, and KPI tracking for management and leadership. These tools must integrate with the core data architecture to ensure consistency.
End-to-end visibility also depends on reliable data ingestion, transformation, and governance, not just tool selection. Without a unified approach, conflicting reports emerge. To avoid this, organizations must invest in maintenance, training, and support to keep tools aligned, effective, and trusted over time.
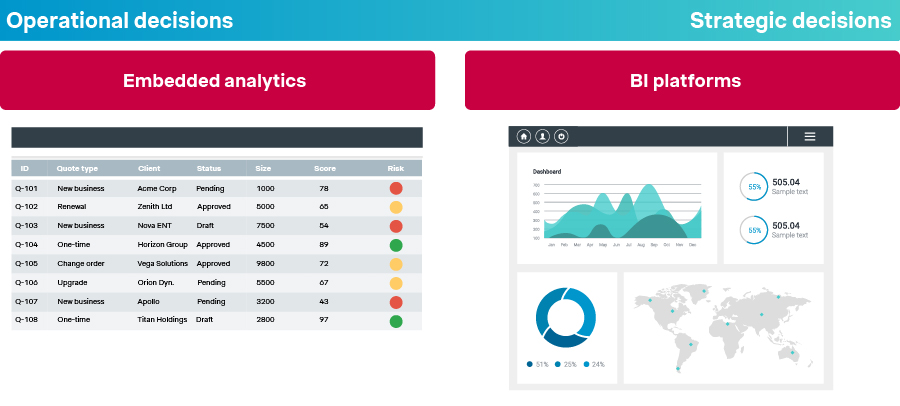
Figure 6: Embedded analytics vs Business Intelligence platforms
3. Automate and accelerate
Once reliable data is in place and analytics are woven into daily work, the natural next step is to scale impact through automation and advanced AI. Automation lifts the ceiling on what people can do by removing repetitive tasks, filling data gaps in real time, and delivering forward‑looking recommendations faster than any analyst could. We use a flexible three-step approach: identify opportunities, build a focused pilot, and scale only what proves its value.
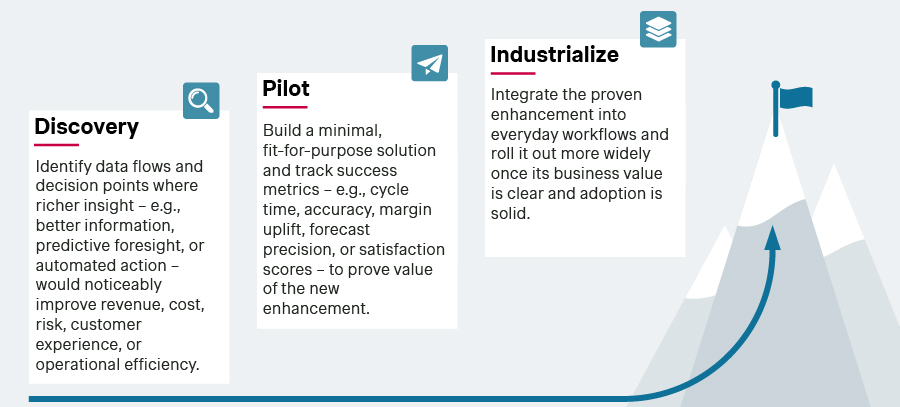
Figure 7: Process to advance your analytics
Automation can start with proven tools (like OCR for extracting data from PDFs) and scale to highly tailored, AI-driven solutions. Options range from “out-of-the-box” accelerators to bespoke models that evolve with your business needs. Below, we outline three different examples showing how this spectrum can turn simple analytics into tangible business value.
3.1. Intelligent data capture
Much of medtech’s valuable data still arrives as PDFs, faxes, or free‑text emails that never reach a database. Modern AI tools extract and route this information into governed repositories. Optical Character Recognition (OCR) converts documents into searchable text, while Natural Language Processing (NLP) structures narrative input for analytics use. Lightweight robotic‑process scripts then load the cleaned data automatically. The immediate payoff is two‑fold: no more manual data entry, and a richer, timelier data pool.
3.2. Predictive decision support
With more complete data, organizations can move to predictive analytics. Machine‑learning shifts focus from reporting to recommending actions. Pricing engines forecast optimal discounts, tender simulators highlight small price shifts that could secure a win, and demand forecasts align production with projected needs. Device‑health analytics even schedule service visits before failures occur. Embedded in tools like CPQ, CLM, or executive dashboards, these insights are immediately actionable without delay for later analysis.
3.3. Self-optimization
Finally, the stack must learn from its own experience, a discipline known as Machine‑Learning Operations (MLOps). MLOps blends software‑engineering and data‑science to monitor data drift, automate retraining, and redeploy updated models without disruption. Every price override, tender outcome, and preventative‑maintenance feedback flows back into the system. Cleaner data sharpens the model; sharper recommendations boost adoption; and wider adoption drives better feedback, creating a cycle of continuous improvement.
By capturing hidden data sources, deploying predictive models that guide real decisions, and embedding self-learning feedback loops, medtech companies elevate analytics from static reports into a self‑improving growth engine.
Wrap-up
Building a robust data and analytics foundation is no longer optional in MedTech. It is the starting line to achieving analytics excellence. By setting dependable data foundations, embedding insight into people, processes, and tools, and then automating and accelerating with AI, companies can move beyond one‑off dashboards to a self‑improving engine that drives margin discipline, faster deal cycles, and new revenue streams.
Remember, becoming data‑driven is not a one-time project but a continuous progression. Leading organizations continuously revisit their use cases, refresh their data strategy, and nurture a culture of evidence‑based decision‑making at every level. If you need a partner to chart this journey, from the first data audit to self‑optimizing AI, Simon-Kucher stands ready to help evolve your RMS into a strategic growth driver.